Data Analysis Project
Logistic Leadtime Analysis with SQL Server
Project Description
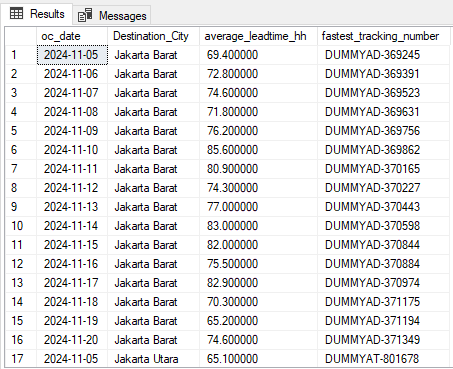
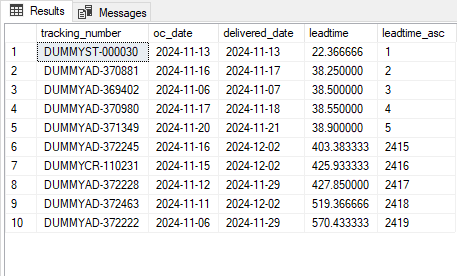
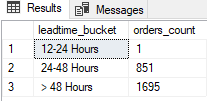
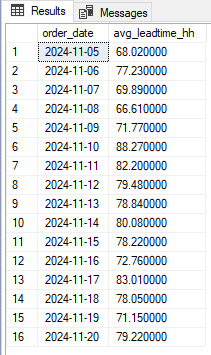
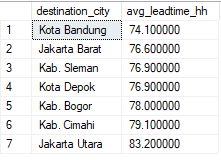
Delivery Performance Analysis using SQL Server. I analyzed delivery data from SalesDb.dbo.TechnicalTest to compute average lead time per city and order date, identify the top 5 fastest and slowest orders, create delivery-time histogram buckets, and track daily lead-time trends. The solution uses window functions (e.g. AVG() OVER, ROW_NUMBER()), DATEDIFF for lead-time calculation, and CASE expressions for bucketing. The queries produce city-level rankings, fastest tracking numbers per day, distribution counts for SLA monitoring, and time-series averages to support operational decisions and targeted improvements.
Project Date
July 2025
Role
SQL, Exploratory Data Analysis, Window Function
Client
Personal Project
Visit
Github Repo